Author: API Webmaster
Video Summary of Case 14-025
Our first real video – what to do if you’ve seen a UFO
It has a bit of that homespun feel, but we’re still learning how to do this:
We need a new logo
Added Redacted 2014 Case Sheet
The spreadsheet showing our 2014 cases has been added to the Investigations page. There are 61 cases listed there.
We’ve re-started our YouTube channel in earnest – please subscribe
We’ll try to do about 1 video a month. Videos will cover both public education and awareness as well as Field Investigator and Skywatcher training. We hope you’ll subscribe.
Here is the first one, to introduce the series:
Report of investigation – 18-008 FB1 New York
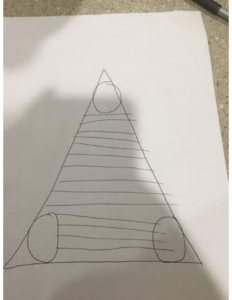
A triangle case from Rochester, New York. Unfortunately, only one of the witnesses was willing to go on record, even anonymously.
Please read the redacted ROI for the details.
Report of investigation 18-004-CE4
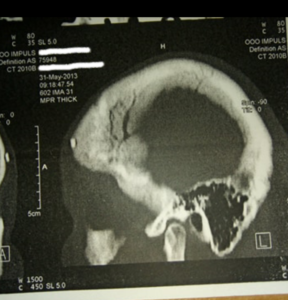
 An interesting CE case from Russia. Unfortunately, we are unable to fully authenticate the CAT scan shown in the report. If you have the knowledge to do so, please contact us.
Case 18-008 Reported
The report is from the 21st of February 2018 in Western New York state, USA. Multiple witnesses saw a triangle shaped object. If you saw something similar around that date, please contact us. Your report will be anonymous.
Unidentified Science 6 – The Probability/Strangeness Matrix
This time I am going to talk about a specific and easy to understand tool for revealing patterns in our data. It is called the Probability/Strangeness matrix, and it has been around for decades, although I’ve yet to see it used to its full potential.
The matrix is very simple. After we have investigated a case, we rate the case on a scale of 0 to 5 for both probability and strangeness. These two ratings are required to be independent – a case can be strange but improbable, it can be probable but not very strange, or any combination. What we are of course most interested in the small fraction of cases in the upper right hand corner of the matrix that are both probable and strange, and how they move on the matrix as the investigation proceeds. It’s very clear from the plot – usually done with probability on the horizontal axis and strangeness on the vertical – what is going on.


