 We’re looking to refresh our logo and lose the flying saucers. We need something more abstract, and something that we can vary a bit for the website, the podcast, and other uses. Any artistic volunteers want to submit your idea?
Added Redacted 2014 Case Sheet
The spreadsheet showing our 2014 cases has been added to the Investigations page. There are 61 cases listed there.
Conversation 10 – Chris Cogswell
Released: 18 April 2018
Duration: 66 minutes, 2 seconds
 Paul Carr is joined by Chris Cogswell, recently resigned director of research at MUFON, about how he and his team are carrying on with an enterprise of scientific research into the UFO phenomena.
Links:
MUFON Director of Research Resigns
Credits:
host and Producer: Paul Carr
Music: DJ Spooky
API Case Files is distributed under the Creative Commons Attribution/Share-Alike License
We’ve re-started our YouTube channel in earnest – please subscribe
We’ll try to do about 1 video a month. Videos will cover both public education and awareness as well as Field Investigator and Skywatcher training. We hope you’ll subscribe.
Here is the first one, to introduce the series:
Report of investigation – 18-008 FB1 New York
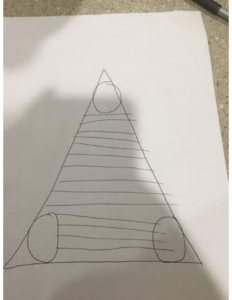
A triangle case from Rochester, New York. Unfortunately, only one of the witnesses was willing to go on record, even anonymously.
Please read the redacted ROI for the details.
Report of investigation 18-004-CE4
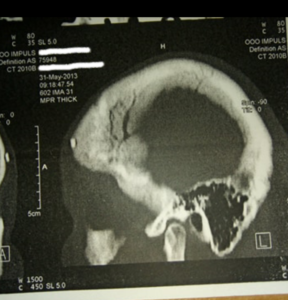
 An interesting CE case from Russia. Unfortunately, we are unable to fully authenticate the CAT scan shown in the report. If you have the knowledge to do so, please contact us.
Some questions answered – API’s methodology
I was recently asked two questions:
- what is our general methodology?
- How do we differ from other organizations?
In this post I am going to address the first of these questions. A near future post will answer the second.
Case 18-008 Reported
The report is from the 21st of February 2018 in Western New York state, USA. Multiple witnesses saw a triangle shaped object. If you saw something similar around that date, please contact us. Your report will be anonymous.
Conversation 9 – Cheryl Costa, Part 2
Recorded: March 23, 2018
Released: 10 April 2018
Duration: 71 Minutes, 4 seconds
Marsha Barnhart arranged a part two conversation with Cheryl Costa, co-author of UFO Sightings Desk  Reference. In part two, they pick up the conversation discussing how Cheryl became interested in writing an on-line UFO sightings column, New York Skies, for the Syracuse New Times, and how she developed mind/consciousness interests via the practices of Shamanism, Buddhism and Remote Viewing. Additionally, Cheryl and Marsha talked about recent media reports of UFO’s by the military and how the media has reacted to this information.
Our Investigative Ethics Statement
We want everyone to know what our ethical stance is, so we are publishing this statement. Please read it and let us know if you have any questions.


